Major Performance Indicators
(*)Please refer to Outline of Consolidated Financial Statementsor quarterly data.
Residential Development Business

| FY2022/3 (Apr. '21 - Mar. '22) |
FY2023/3 (Apr. '22 - Mar. '23) |
FY2024/3 (Apr. '23 - Mar. '24) |
FY2025/3 (Apr. '24 - Mar. '25) |
FY2026/3 (Apr. '25 - Mar. '26) |
|
|---|---|---|---|---|---|
| Housing sales (units) |
4,329 | 4,142 | 4,298 | 3,760 | 3,473 |
| Completed housing inventories (released for sale) (units) |
130 | 222 | 248 | 141 | 225 |
| Completed housing inventories (unreleased) (units) |
253 | 199 | 279 | 99 | 495 |
Commercial Real Estate Business
| FY2022/3 (Apr. '21 - Mar. '22) |
FY2023/3 (Apr. '22 - Mar. '23) |
FY2024/3 (Apr. '23 - Mar. '24) |
FY2025/3 (Apr. '24 - Mar. '25) |
FY2026/3 (Apr. '25 - Mar. '26) |
|
|---|---|---|---|---|---|
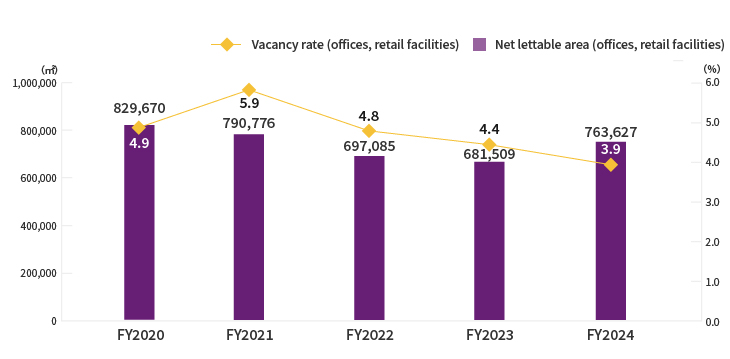
| Vacancy rate (offices, retail facilities)(*1) |
5.9% | 4.8% | 4.4% | 3.9% | 13.7% |
| Net lettable area (offices, retail facilities) (sqm)(*1) |
790,776 | 697,085 | 681,509 | 763,627 | 601,401 |
(*1)As of April 1, 2022, Nomura Real Estate Development Co., Ltd. and Nomura Real Estate Building Co., Ltd. were merged (Nomura Real Estate Development Co., Ltd. as the surviving company), and partial revision was made to the method used to calculate the net lettable area and the vacancy rate in Commercial Real Estate segment. Due to this change, the figures listed are changed. From 4Q of the fiscal year ended March 2025, vacancy rates for properties that have been completed for more than one year will be calculated.
Investment Management Business

| FY2022/3 (Apr. '21 - Mar. '22) |
FY2023/3 (Apr. '22 - Mar. '23) |
FY2024/3 (Apr. '23 - Mar. '24) |
FY2025/3 (Apr. '24 - Mar. '25) |
FY2026/3 (Apr. '25 - Mar. '26) |
|
|---|---|---|---|---|---|
| Assets under management (millions of yen)(*2) |
1,948,071 | 1,957,676 | 2,022,606 | 2,070,346 | 2,386,218 |
(*2)The assets under management of Nomura Real Asset Investment Co., Ltd. totaled 143.4 billion yen as of the end of FY26/3. Assets under management of Private funds, etc includes our share of assets under management, calculated based on our equity stake of 49%, amounting to 70.2 billion yen.
Property Brokerage & CRE Business

| FY2022/3 (Apr. '21 - Mar. '22) |
FY2023/3 (Apr. '22 - Mar. '23) |
FY2024/3 (Apr. '23 - Mar. '24) |
FY2025/3 (Apr. '24 - Mar. '25) |
FY2026/3 (Apr. '25 - Mar. '26) |
|
|---|---|---|---|---|---|
| Brokerage: Number of transactions | 10,081 | 9,985 | 10,204 | 10,444 | 10,643 |
| Brokerage: Total transaction value (millions of yen) | 964,882 | 1,060,313 | 1,221,849 | 1,391,101 | 1,587,082 |
Property & Facility Management Business

| FY2022/3 (Apr. '21 - Mar. '22) |
FY2023/3 (Apr. '22 - Mar. '23) |
FY2024/3 (Apr. '23 - Mar. '24) |
FY2025/3 (Apr. '24 - Mar. '25) |
FY2026/3 (Apr. '25 - Mar. '26) |
|
|---|---|---|---|---|---|
| Buildings under management | 772 | 782 | 794 | 803 | 805 |
| Condominiums under management (units) | 186,549 | 189,574 | 193,959 | 197,906 | 201,357 |